Accessing the Dashboard
Run/web in Telegram to get a login link:
The link is tied to your Telegram session. You can access the dashboard from any device by opening the link.
Agent Chat (⌘K)
Press ⌘K (Mac) or Ctrl+K (Windows/Linux) anywhere in the dashboard to open the Agent chat panel — the same conversational agent you use in Telegram, docked beside whatever you’re working on. Press the shortcut again to hide it. From the panel you can:- Chat with any of your agents, and run multiple sessions on different agents
- Trigger actions — create or stop executors, deploy bots, place orders (sensitive actions ask for confirmation first)
- Ask about what you’re viewing: when a report is open, the chat knows which report it is, so you can ask things like “explain this report” or “give me the code of this routine”
Features
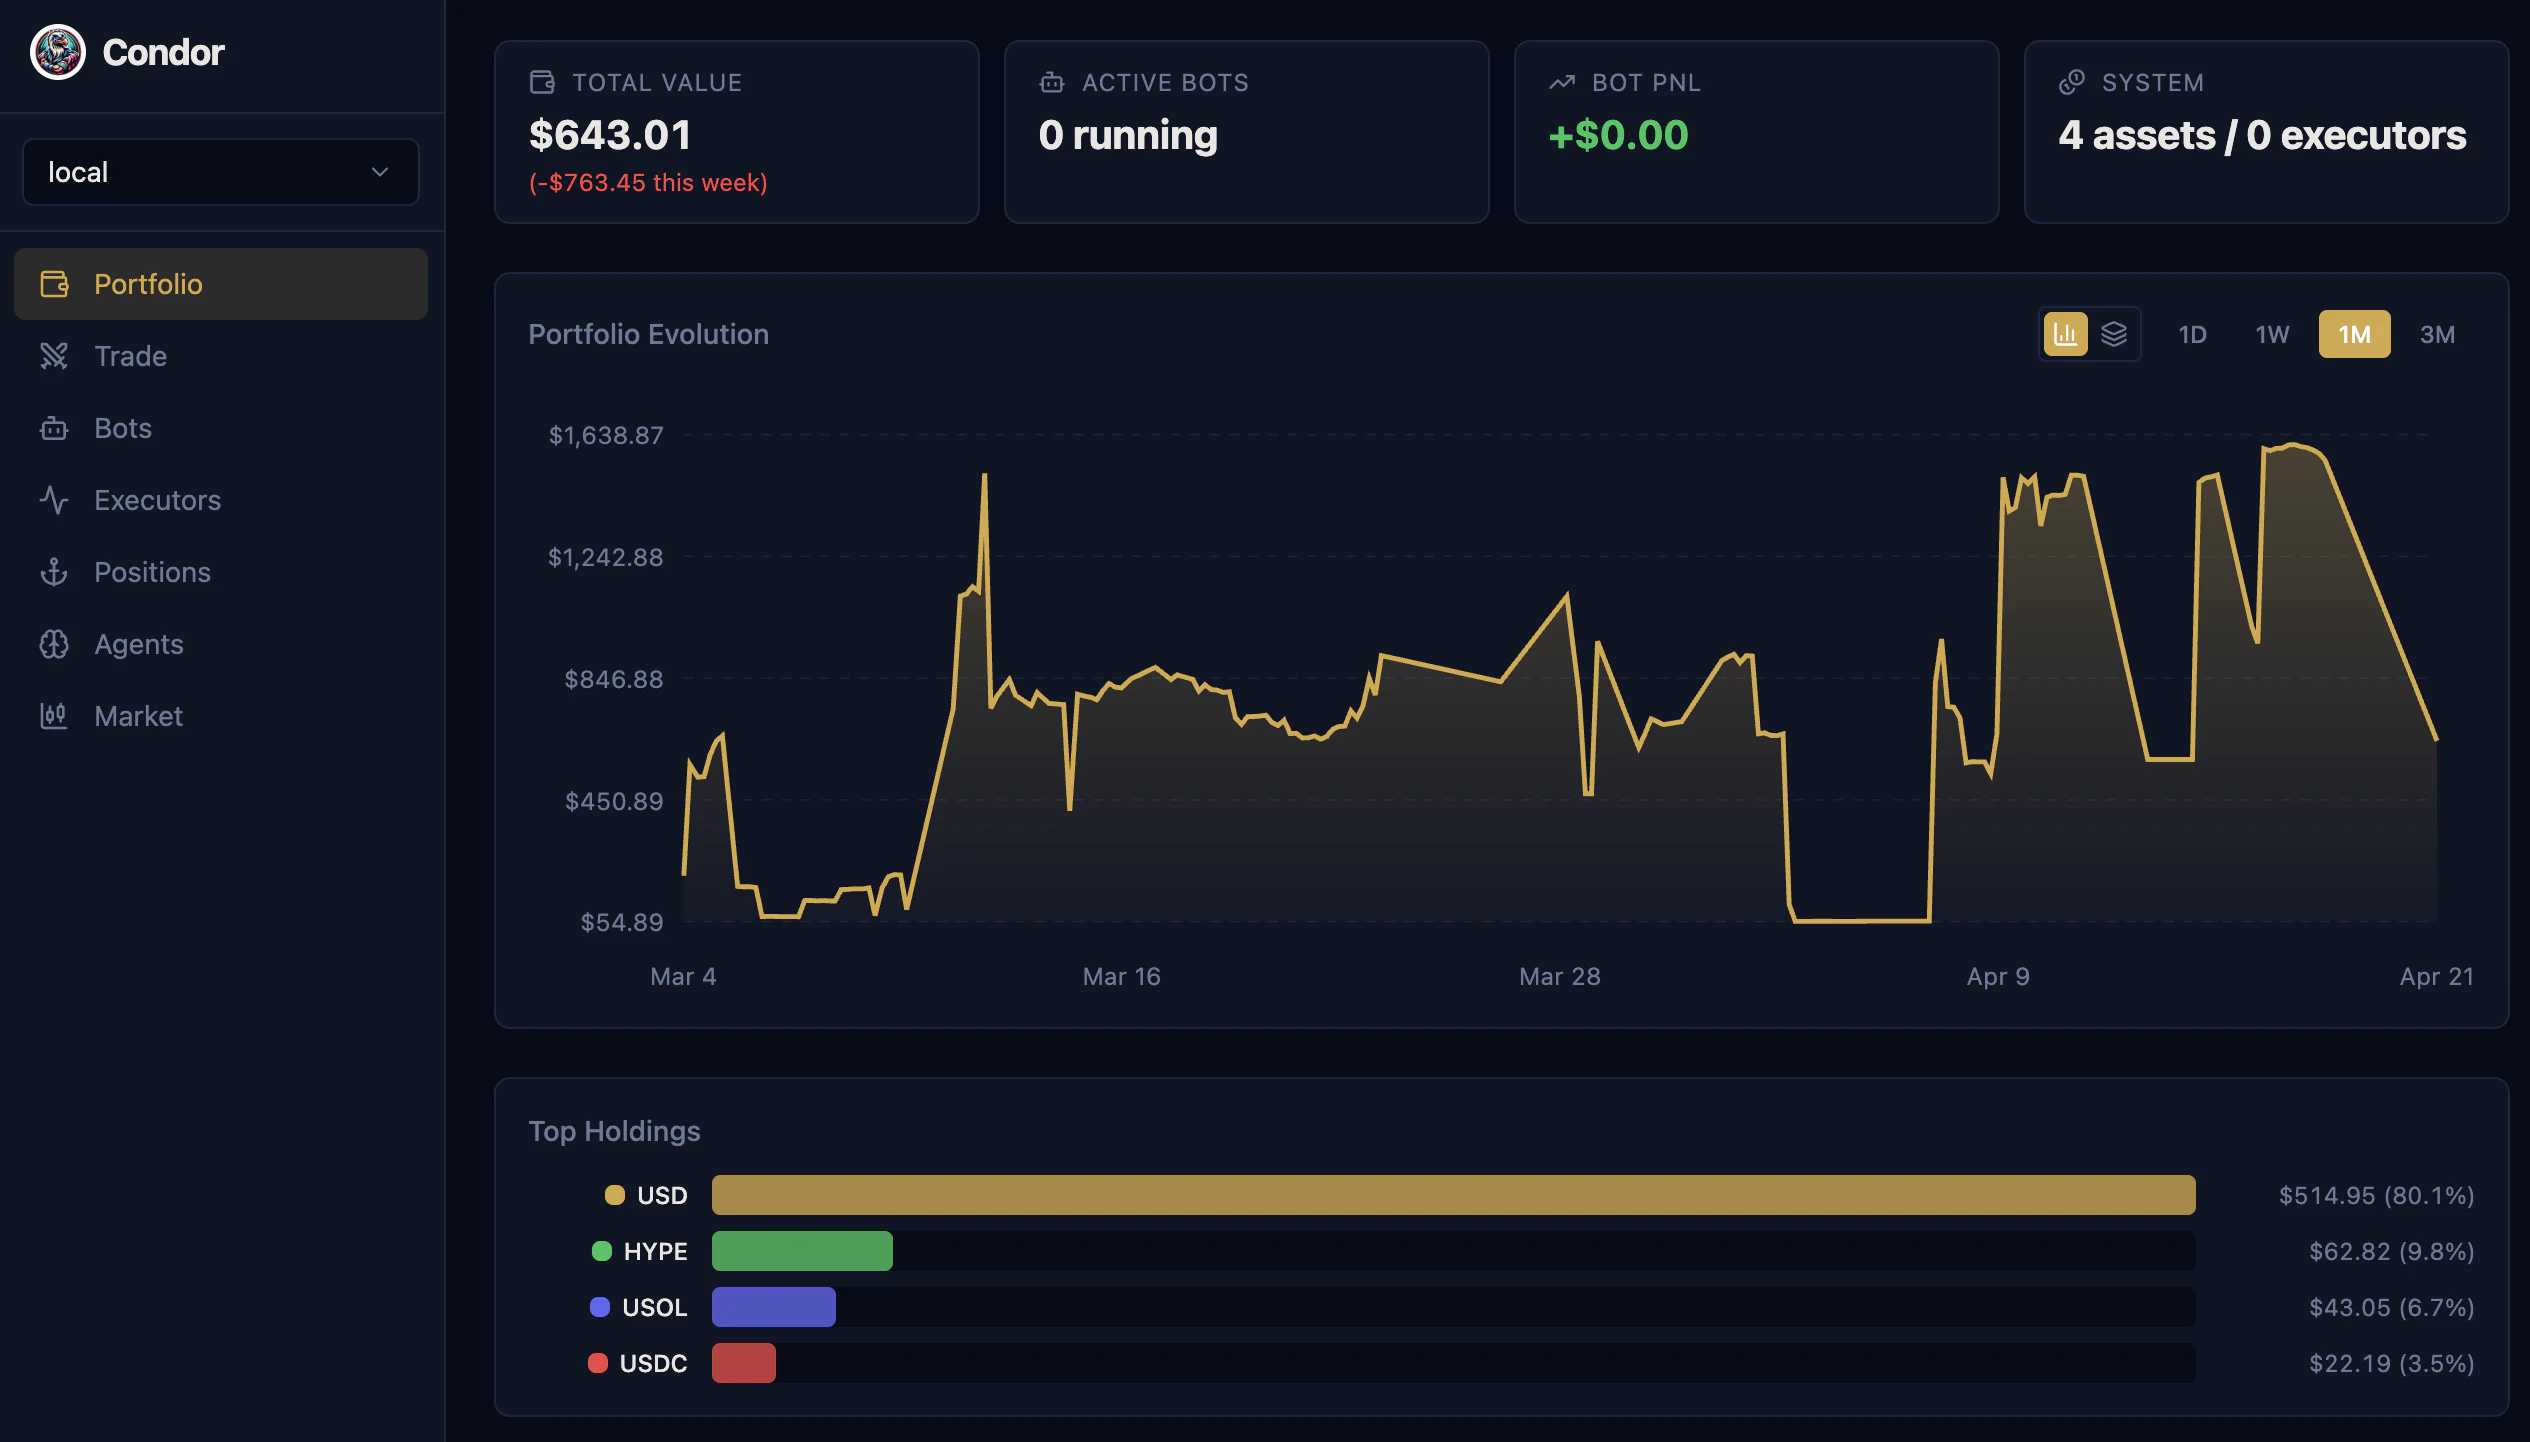
Portfolio
View your unified portfolio across all connected exchanges:- Real-time balance updates
- Portfolio value history charts
- Asset distribution visualization
- 24-hour P&L tracking
Trade
Unified trading interface combining market data and order execution:- Charts: OHLC candles with executor overlays
- Depth: Order book visualization and live trades
- Positions: Active positions with P&L
- Config: Create and manage executor configurations
Bots
Deploy and manage bot instances. A bot is one container that can run multiple controllers across different markets at once. The Bots page is organized into tabs:- Active: Running bots with realized, unrealized, and total P&L, volume traded, and uptime. When a bot runs more than one controller, a combined P&L chart aggregates them, with toggle chips to isolate any single controller. You can edit a running bot’s controller config and push it live without restarting — only fields the controller marks as updatable are applied.
- Runs: Performance history over time for the bots you’ve run, built from the controller snapshots the Hummingbot API records every 5 minutes (realized/unrealized P&L and volume).
- Editor: IDE-like editor for controllers and configs (see Editor).
- Backtest: Backtest a V2 controller config against historical data.
- Archived: Stopped bots, kept for later review.
Editor
Manage controllers and configurations in an IDE-like interface:- Controllers: View and edit controller Python code
- Configs: Create, clone, and modify YAML configurations
- Upload: Import controller files or config YAMLs
- Templates: Create new configs from controller templates
Executors
Create and manage trading executors directly from the browser:- Grid, DCA, TWAP, Position executors
- Visual configuration interface
- Live performance metrics
- One-click start/stop controls
Positions
Track open positions across all exchanges:- Real-time P&L updates
- Position size and leverage
- Entry and mark prices
- Quick access to close positions
Agents
Monitor your autonomous Trading Agent sessions:- Overview: Strategy summary and current state
- Sessions: Trade history with chart overlays
- Strategy & Learnings: View and edit agent configuration inline
- Switch between multiple agent sessions
Routines
Run and monitor routines:- Run: Execute routines with custom parameters
- Schedule: Set up recurring runs (every minute up to every 6 hours)
- Reports: Browse generated HTML reports with interactive Plotly charts in a full-screen viewer; use the left/right arrow keys to step through a routine’s report history
Settings
- Servers: Register multiple Hummingbot API servers (one per client or environment) and switch the active server from the top bar. Add, edit, set a default, or remove servers.
- API Keys: Add exchange credentials directly in the dashboard — pick the exchange, fill in the required fields, and the credential is saved (secret fields are masked).
- Gateway: Check Gateway status, start/stop/restart it, pull a Gateway Docker image (
latest,development, or a custom tag), and view Gateway logs.
Themes
A theme toggle in the top bar cycles through three modes: dark, light, and a color-blind mode that uses a color-blind-friendly palette for charts and indicators. Your choice is remembered in the browser.Web + Telegram Sync
The web dashboard shares state with Telegram:- Start a Trading Agent on Telegram → monitor in the dashboard
- Deploy an executor in the dashboard → get notifications on mobile
- Portfolio updates appear everywhere instantly
- Same session, same data, seamless switching
Custom Server Setup
By default, Condor runs the web dashboard onhttp://localhost:8088. To access from other devices:
-
Set
WEB_URLin your.envfile: -
Restart Condor:
-
Run
/webin Telegram to get a new login link with the updated URL
Session Management
Login tokens expire after 5 minutes but your session remains active once authenticated. If your session expires:- Run
/webin Telegram again - Click the new login link
- Your previous state is preserved
Tech Stack
| Technology | Purpose |
|---|---|
| Vite + React 19 | Framework |
| TypeScript | Type safety |
| Tailwind CSS v4 | Styling |
| shadcn/ui + Radix UI | Components |
Next Step
Seeing Your Portfolio
View your balances and positions across all exchanges